Days Sales Outstanding (DSO) is a financial metric that measures the average number of days a company takes to collect payment after making a credit sale. It quantifies accounts receivable efficiency and directly affects working capital. A lower DSO means faster cash conversion; a higher DSO signals collection delays, credit risk exposure, or invoice process failures. Enterprise finance teams using AI-powered AR automation typically reduce DSO by 20–30%.
Global average DSO
59 days
All sectors · Hackett Group / Allianz Trade, 2023
Top-quartile DSO
~37 days
Automation-mature enterprises · Hackett Group, 2024
DSO reduction with Emagia
20–30%
Achieved within first year of deployment
Cost per extra DSO day
~$2.7M
Per $1B annual revenue · working capital calculation
Days Sales Outstanding (DSO) Explained
| Term | Definition |
|---|---|
| Days Sales Outstanding (DSO) | A financial metric that measures the average number of days it takes a company to collect payment after a credit sale. |
| Formula | DSO = (Accounts Receivable ÷ Total Credit Sales) × Number of Days |
| Purpose | Measures accounts receivable efficiency and cash flow performance. |
| Lower DSO | Indicates faster collections and stronger liquidity. |
| Higher DSO | May indicate delayed payments, disputes, or inefficient collections. |
Accounts Receivable Metrics Framework
Finance leaders monitor several key accounts receivable metrics to evaluate cash flow performance:
- Days Sales Outstanding (DSO)
- Average Days Delinquent (ADD)
- Accounts Receivable Turnover
- Cash Conversion Cycle (CCC)
Among these, DSO is the most widely used indicator of collections efficiency and the primary lever for improving working capital.
How to Calculate DSO (Days Sales Outstanding)
To compute DSO, divide accounts receivable during a given period by total credit sales during the same period, then multiply by the number of days in the period.
Days Sales Outstanding Formula
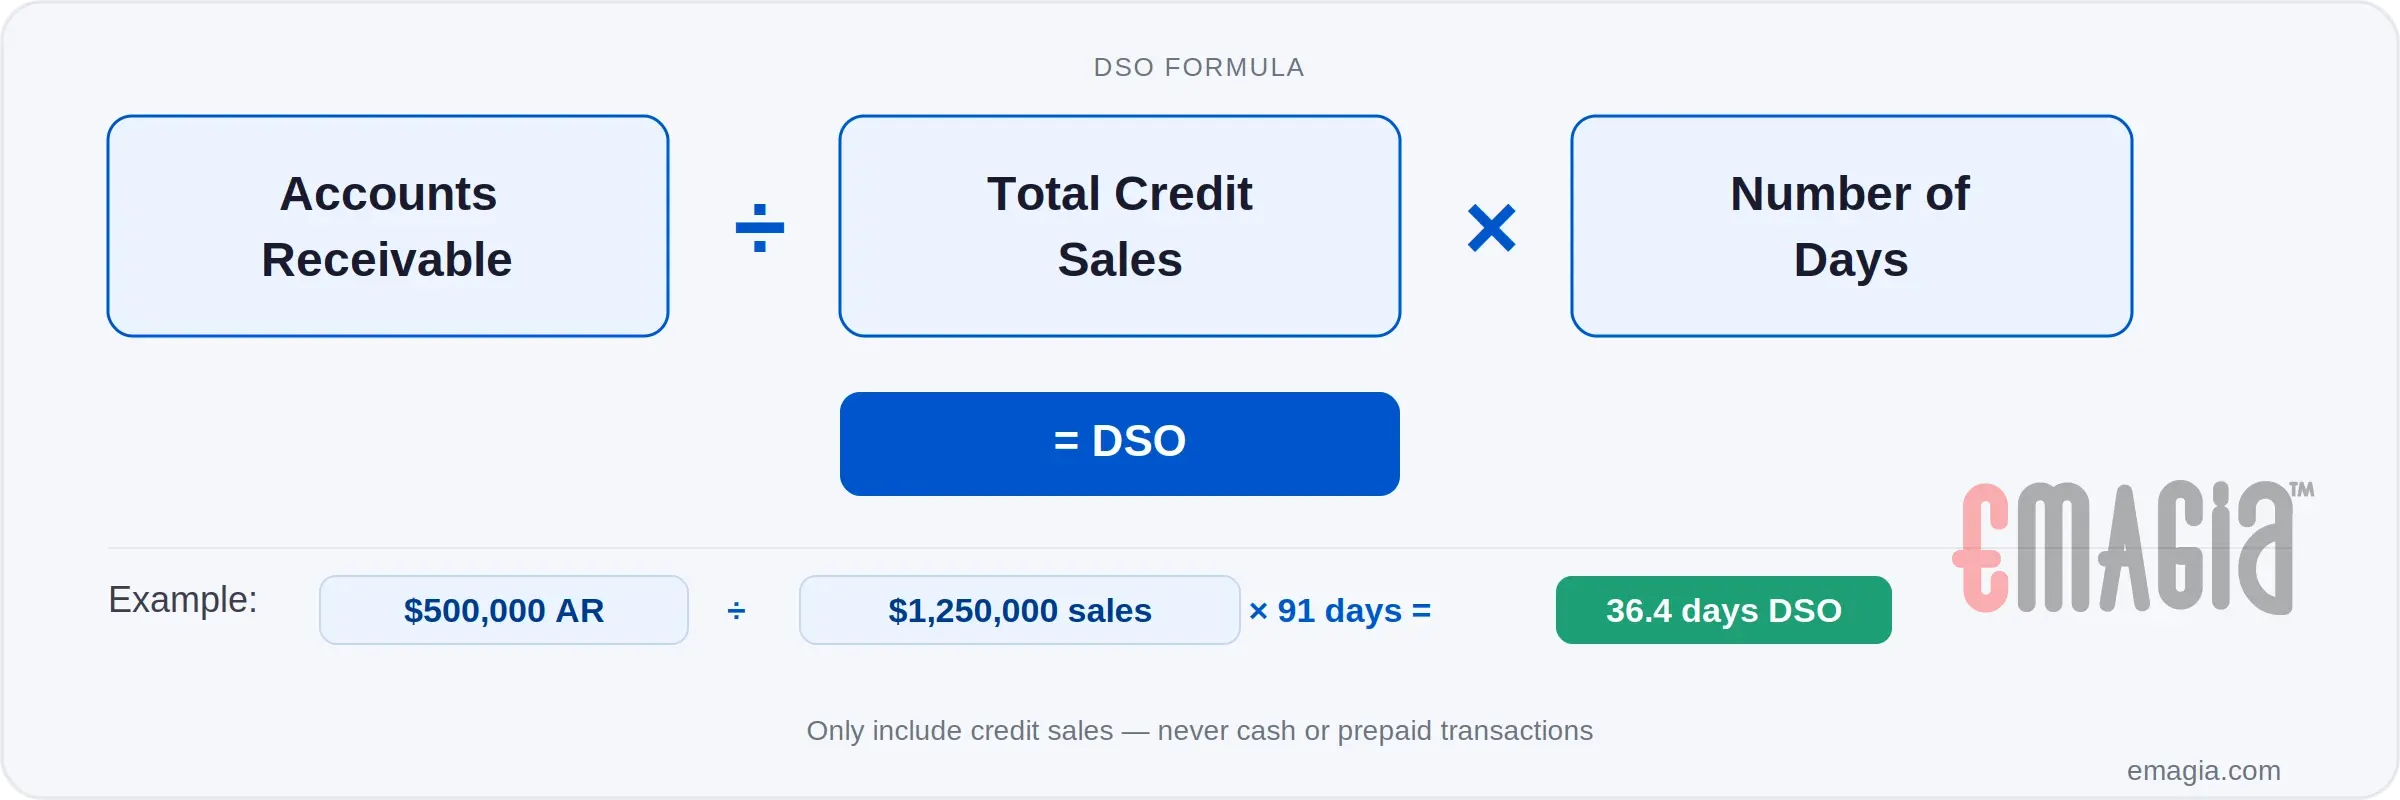
DSO = (Accounts Receivable ÷ Total Credit Sales) × Number of Days
Example of DSO Calculation
| Metric | Value |
|---|---|
| Total Credit Sales | $1,250,000 |
| Accounts Receivable | $500,000 |
| Days in Period | 91 |
| Calculated DSO | 36.4 Days |
Steps to Calculate Days Sales Outstanding
- Determine the total accounts receivable for the selected period.
- Calculate total credit sales for the same period (credit only — exclude cash and prepaid).
- Divide accounts receivable by total credit sales.
- Multiply the result by the number of days in the period.
DSO Calculation Example
($500,000 / $1,250,000) × 91 = 36.4 days
Or suppose total accounts receivable is $850,000 on the same credit sales for a quarter:
($850,000 / $1,250,000) × 91 = 61.9 days
In the second example, it is taking almost 62 days to collect versus 36.4 days. Whether that is acceptable depends on payment terms. This can be measured by the “Best Possible” DSO — what DSO would be if every invoice were paid exactly on the due date.
If all sales are on Net 30 terms, Best Possible DSO = 30. On Net 60, Best Possible DSO = 60. If terms are mixed, Best Possible DSO is the weighted average. A “good” actual DSO is within 15% of Best Possible DSO. Anything more than 15% above Best Possible has room for improvement.
What Does DSO Indicate?
DSO is a general indicator, not a precise meter pointing to one cause. In calculating DSO, a company learns how quickly customers are paying and the efficacy of the collections department — but collections is not the whole story.
A high DSO can indicate delays in receiving payments due to creditworthiness issues, invoicing errors, or weak collections discipline. A low DSO generally indicates the company collects quickly, but an extremely low DSO may signal that credit terms are too aggressive and are constraining sales growth.
Interpreting DSO requires context: invoice timing, seasonal effects, quarter-end sales influxes, product quality disputes, and extended terms offered by sales teams to close deals all affect the number. Regular measurement — monthly is best — reveals the trends that matter more than any single reading.
DSO is also an external signal. Investors monitor DSO alongside revenue. A rising DSO can compress valuation multiples and trigger covenant scrutiny from lenders.
Why Days Sales Outstanding Matters for CFOs
Days Sales Outstanding is a strategic CFO-level indicator that directly impacts liquidity, working capital efficiency, borrowing costs, and investor confidence — not just an AR team metric.
- Working capital: High DSO ties up cash in receivables that cannot fund operations, pay down debt, or fuel growth initiatives.
- Bad debt risk: The probability of non-collection rises sharply after 60 days. Chronic high DSO compounds bad debt write-offs directly into the P&L.
- Investor perception: Rising DSO signals deteriorating cash management to lenders and investors, potentially affecting credit ratings and valuation multiples.
- Cost of carry: For a $1B revenue business, every extra DSO day locks up ~$2.7M. At a 5% cost of capital, that is $137,000 in annual carry cost — per day.
Finance leaders who monitor DSO trends proactively can identify invoicing delays, dispute backlogs, and credit policy gaps before they become quarter-end cash flow problems.
How a Good O2C Process Supports Good DSO
Given the factors above, the entire order-to-cash (O2C) process has much to do with DSO. Improvements in O2C processes are directly rewarded with lower DSO. Billing must be timely and accurate — a company that does not send invoices until a week after shipping is adding days to its DSO before collections even begins.
Similarly, a well-organised, disciplined and data-driven collections department sees more on-time payments. Customers prioritise payments to vendors who follow up consistently. Poor collections habits encourage slow payment.
What Causes High DSO in Enterprise AR?
Understanding why DSO rises is the first step to reducing it. The causes fall into three categories — and in enterprise environments, all three typically coexist.
Process failures include manual invoicing that delays delivery, error-prone remittance matching that creates unapplied cash, and reactive dunning that contacts customers after payment is already overdue rather than proactively before it becomes late.
Data failures include lack of real-time visibility into which invoices are at risk, no predictive model for customer payment behaviour, and disconnected systems between ERP, CRM, and AR that create reconciliation delays and reporting blind spots.
Credit failures include onboarding customers without adequate credit risk assessment, extending payment terms beyond what a customer’s payment history supports, and failing to identify early signs of customer financial distress before they become bad debt write-offs.
Manual processes create data gaps; data gaps prevent accurate credit decisions; poor credit decisions generate the high-risk receivables that inflate DSO. AI-powered AR automation addresses all three simultaneously.
What is Best Possible DSO?
Best Possible DSO represents the ideal scenario where every customer pays exactly on the invoice due date. It is the theoretical minimum DSO given your current payment terms.
- If payment terms are Net 30, Best Possible DSO = 30 days.
- If payment terms are Net 60, Best Possible DSO = 60 days.
- If terms vary by customer, Best Possible DSO is calculated as a weighted average of terms by revenue share.
The gap between your actual DSO and Best Possible DSO — called Average Days Delinquent (ADD) — is the most actionable metric for collections improvement programmes.
What is a Good DSO?
A good DSO depends on your industry, payment terms, and customer mix. The right benchmark is your own payment terms, not a generic industry number.
- Companies on Net 30 terms target a DSO of 30–40 days.
- A DSO more than 50% above your payment terms warrants immediate investigation.
- Best-in-class organisations maintain DSO within 10–15% of Best Possible DSO.
- If more than 20% of your AR is aging past 60 days, your collections process has a structural problem.
DSO Benchmarks by Industry (2026)
Days Sales Outstanding varies significantly across industries due to differences in billing complexity, payment terms, and sales cycle length. The global average across all sectors reached 59 days in 2023 — the largest single-year increase since 2008. Always benchmark against your own payment terms first.
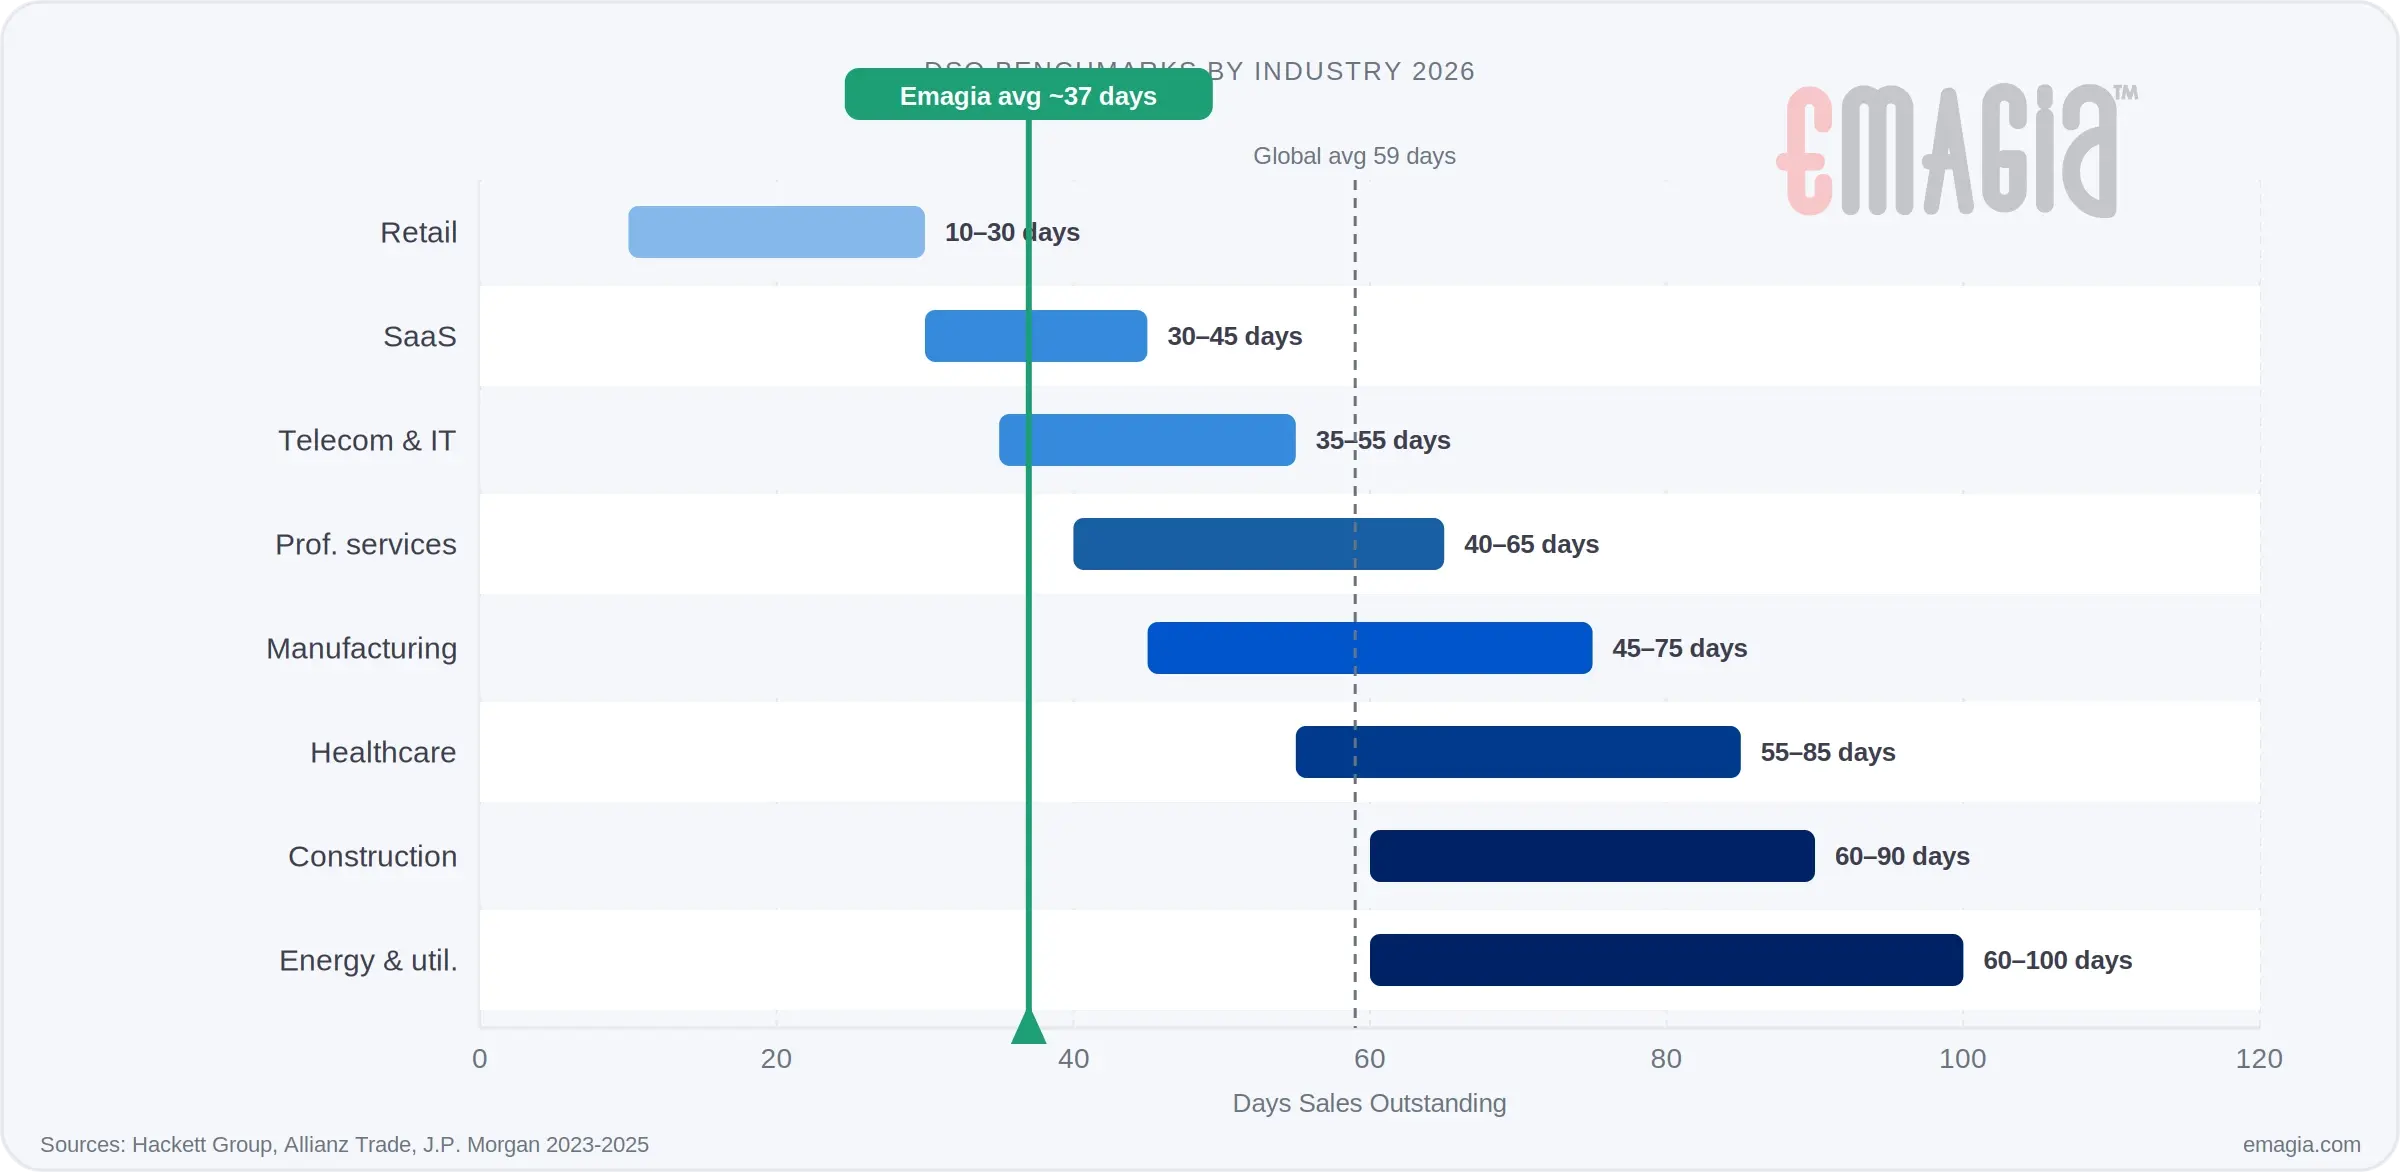
| Industry | Typical DSO Range | Key driver |
|---|---|---|
| Retail & e-commerce | 10–30 days | Mostly point-of-sale; fast collection cycle |
| Software / SaaS | 30–45 days | Annual prepayments compress DSO significantly |
| Manufacturing | 45–75 days | Complex billing, high invoice volume |
| Professional services | 40–65 days | Project-based billing drives variability |
| Telecom & IT | 35–55 days | High volume, subscription complexity |
| Construction | 60–90 days | Retention holdbacks extend cycles |
| Healthcare | 55–85 days | Insurance processing and claim delays |
| Energy & utilities | 60–100 days | Long project and regulatory billing cycles |
Sources: Hackett Group, Allianz Trade, J.P. Morgan — 2023–2025 working capital studies
DSO vs Other Accounts Receivable Metrics
| Metric | Description |
|---|---|
| Days Sales Outstanding (DSO) | Average number of days to collect payment after a sale. |
| Average Days Delinquent (ADD) | Measures how late payments are beyond the due date (Actual DSO minus Best Possible DSO). |
| Accounts Receivable Turnover | Indicates how frequently receivables are collected during a period. |
| Cash Conversion Cycle (CCC) | Measures how long it takes to convert investments into cash (DSO + DIO − DPO). |
DSO vs DPO vs DIO: The Cash Conversion Cycle
Days Sales Outstanding is one component of the broader Cash Conversion Cycle (CCC), which measures how quickly a company converts investments into cash.
CCC = DSO + DIO − DPO
| Metric | What it measures | Goal |
|---|---|---|
| DSO — Days Sales Outstanding | Time to collect from customers | Lower = better (faster cash in) |
| DPO — Days Payable Outstanding | Time to pay suppliers | Higher = better (extend cash outflow) |
| DIO — Days Inventory Outstanding | Time to sell inventory | Lower = better (less capital tied up) |
Reducing DSO has the most directly controllable impact on the CCC for most B2B enterprises — it addresses cash already earned but not yet collected. See our full accounts receivable automation guide for how to optimise the complete O2C cycle.
How Companies Reduce Days Sales Outstanding
Finance leaders use several proven strategies to improve collections performance and reduce DSO.
- Automating invoice generation and delivery to eliminate manual delays
- Implementing AI-driven credit risk assessment to avoid extending terms to high-risk customers
- Streamlining dispute and deduction management to prevent payment holds
- Using predictive analytics for collections prioritisation to act before invoices become overdue
- Implementing AI-powered accounts receivable automation across the full O2C cycle
Enterprises that digitise their order-to-cash process consistently achieve faster cash collections and improved working capital performance than those relying on manual workflows.
How AI-Powered Technology Reduces DSO
AI and machine learning have taken accounts receivable automation to an entirely new level — moving from rule-based systems to intelligent, predictive platforms that anticipate problems before they inflate DSO.
Emagia’s AI-powered AR and O2C automation platform unites all stages of the order-to-cash process into a single intelligent system. O2C data gathered into a single repository provides timely information to the collections module, improving timeliness and accuracy across every workflow.
Six ways Emagia’s AI reduces DSO:
- Predictive collections prioritisation: AI analyses payment history, invoice age, and customer signals to identify at-risk accounts before they become overdue — so collectors act where intervention changes outcomes.
- Automated dunning with dynamic timing: Instead of fixed reminder schedules, AI determines the optimal time, channel, and tone for each customer based on historical payment patterns.
- 95%+ auto-cash posting: Emagia’s cash application AI matches incoming payments to open invoices automatically, eliminating the unapplied cash backlog that artificially inflates DSO.
- Accelerated credit onboarding: Automated credit decisions reduce approval time from days to hours, enabling 5× faster customer onboarding and earlier invoicing.
- Self-service customer portal (EIPP): Customers view invoices, raise disputes, and pay digitally without calling AR — reducing payment friction and accelerating collection.
- Real-time DSO dashboards: CFO-level visibility into live DSO by business unit, region, and customer segment — enabling intervention before it becomes a quarter-end problem.
Users of Emagia’s AR & O2C automation platform are achieving 85% or more current AR and a 30% reduction in DSO. AI technology is making a measurable improvement in financial operations efficiency, directly reflected in Days Sales Outstanding performance.
Factors That Affect Days Sales Outstanding
- Customer payment behaviour and creditworthiness
- Invoice accuracy and delivery timing
- Credit policies and payment terms offered
- Disputes, deductions, and resolution cycle time
- Collections strategy — reactive vs predictive
- ERP and AR system integration and data quality
- Seasonal sales patterns and quarter-end effects
Key Takeaways
- DSO measures the average number of days to collect payment after a credit sale.
- The formula is: (Accounts Receivable ÷ Total Credit Sales) × Days in Period.
- Lower DSO improves cash flow, working capital, and investor confidence.
- Higher DSO signals process failures, data gaps, or credit policy weaknesses.
- Every extra DSO day costs a $1B business ~$2.7M in locked working capital.
- AI-powered AR automation reduces DSO by 20–30% within the first year of deployment.
- Always benchmark DSO against your own payment terms, not just industry averages.
Frequently Asked Questions About DSO
What does DSO mean in finance?
DSO stands for Days Sales Outstanding. It measures the average number of days a company takes to collect payment after making a credit sale. A lower DSO means faster cash conversion and stronger working capital. A higher DSO signals collection delays, invoicing problems, or credit risk exposure in accounts receivable.
How is DSO calculated?
DSO is calculated using the formula: (Accounts Receivable ÷ Total Credit Sales) × Number of Days in Period. For a quarterly calculation, divide outstanding receivables by credit sales for the quarter, then multiply by 90. Only include credit sales — not cash or prepaid transactions — to get an accurate result.
Why is DSO important?
DSO indicates how efficiently a company collects payments and manages accounts receivable. It directly impacts cash flow, working capital availability, and the cost of running the business. For CFOs, a rising DSO trend is an early warning signal of collections process failure, credit policy weakness, or deteriorating customer payment behaviour.
What is a good DSO ratio?
A good DSO is close to your payment terms. For Net 30 businesses, a DSO under 35 days indicates healthy collections. For Net 60, under 70 days is acceptable. The global enterprise average is approximately 59 days across all sectors, but top-quartile organisations using AI-powered AR automation consistently reach 35–40 days.
What causes high DSO?
High DSO is typically caused by late invoice delivery, reactive rather than proactive payment reminders, slow or inaccurate cash application creating unapplied cash, and customers paying beyond agreed terms. In enterprise environments, disconnected ERP and AR systems and a lack of real-time visibility into at-risk accounts are the most common root causes.
What causes DSO to increase?
DSO increases when invoices are delayed, disputes go unresolved, collections follow up reactively, or customers face financial difficulty. Seasonal sales spikes at quarter-end also temporarily inflate DSO. In enterprise AR, manual matching errors that create unapplied cash are a hidden but significant driver of DSO inflation over time.
How can automation reduce DSO?
AI-powered AR automation reduces DSO by predicting at-risk accounts before invoices become overdue, sending dunning reminders at the optimal time per customer, posting incoming payments at 95%+ auto-match rates to eliminate unapplied cash, and providing real-time AR visibility for finance leaders. Emagia customers typically reduce DSO by 20–30% within the first year.
How often should companies measure DSO?
Most organisations measure DSO monthly to track trends and catch problems early. Quarterly DSO is useful for board-level reporting and working capital benchmarking. A single month’s figure is less meaningful than a 6-month trend line — watch for a DSO that is consistently rising quarter over quarter, not just a single spike.
See How Emagia Reduces DSO for Global Enterprises
Emagia’s AI-powered autonomous finance platform helps enterprise finance teams recover working capital by eliminating the manual bottlenecks that inflate DSO. Customers achieve 20–30% DSO reduction, 95%+ auto-cash posting, and 5× faster customer onboarding — without adding headcount.
Recognised by Gartner (Visionary), IDC (Major Player & Leader), and Everest Group (Leader) for AR automation.
